Overexpression Stable Cell Line Generation
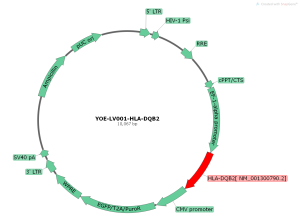
Case 1: Stable HLA-DQB2 overexpression HeLa Cell Line Generation
Backbone Maps:
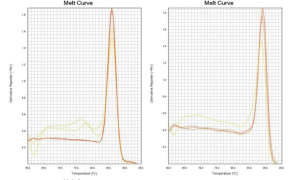
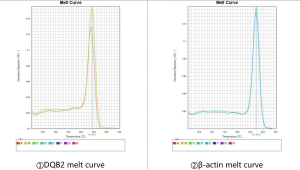
Melt Curve:
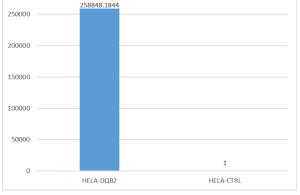
Gene Expression:
Expression rate (%)
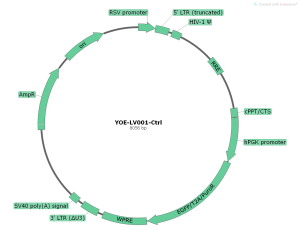
Case 2: The Human TREM2 and Human DAP12 genes were overexpressed in HEK293 Cell Line.
Plasmid information:
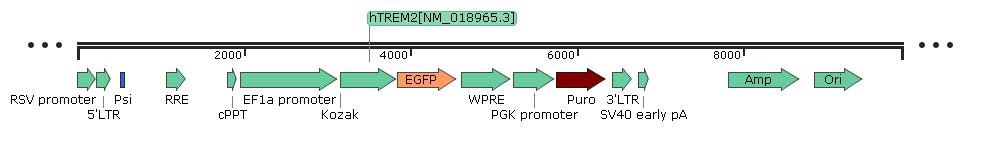
LV-EF1a>hTREM2/EGFP-PGK>Puro
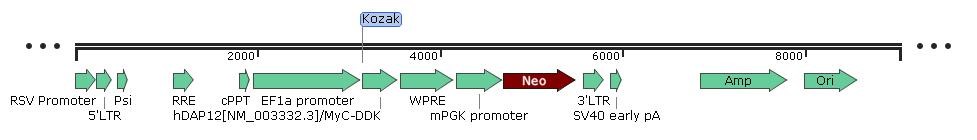
Vector Map:
RT-qPCR:
| Gene name | Primer name | Primer sequence | Fragment size | |
| hGAPDH | hGAPDH-F | GGTGTGAACCATGAGAAGTATGA | 123bp | |
| hGAPDH-R | GAGTCCTTCCACGATACCAAAG | |||
| hTREM2 | hTREM2-F | CTGGAGATCTCTGGTTCCCC | 218bp | |
| hTREM2-R | TTCACTGGGTGGATGTGTCC | |||
| hDAP12 | hDAP12-F | GCGATTGCAGTTGCTCTACG | 154bp | |
| hDAP12-R | TGTTTCCGGGTCGCTGC | |||
Relative quantitative method was used to detect the expression change of the target gene, and the data was analyzed according to the 2-ΔΔCT method.
| sample name | 1 | 2 | ΔCT (1-2) | ΔΔCT (experimental – control) | 2-ΔΔCT | Expression efficiency |
| hTREM2 | hGAPDH | |||||
| experimental | 16.117 | 14.846 | 1.271 | -18.41 | 348280.88 | 34828088% |
| control | 34.758 | 15.077 | 19.681 | 0 | 1 | 100% |
| sample name | 1 | 2 | ΔCT (1-2) | ΔΔCT (experimental – control) | 2-ΔΔCT | Expression efficiency |
| hTREM2 | hGAPDH | |||||
| experimental | 13.7 | 14.846 | -1.147 | -21.189 | 2390187.0 | 239018700% |
| control | 35.119 | 15.077 | 20.042 | 0 | 1 | 100% |
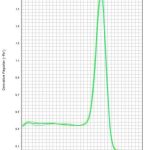
Dissolution curves of hTREM2, hDAP12 and hGAPDH: